Platform Lifecycle Demo
This demo describes one way to express platform lifecycle automation using compose.mk, focusing on data and control flows without doing any real work. If you want something that's more than a toy, see the WIP sibling project that's focused on kubernetes over at k8s-tools.
Basic Platforming
Consider the following Makefile:
#!/usr/bin/env -S make -f
# Demonstrating a way to organize platform lifecycle automation with `compose.mk`.
# We use namespace-style dispatch here to run commands in docker-compose managed
# containers, and use `compose.mk` workflows to to describe data-flow.
#
# Part of the `compose.mk` repo. This file runs as part of the test-suite.
# See also: http://robot-wranglers.github.io/compose.mk/demos/platform
# USAGE: ./demos/platform.mk

include compose.mk

__main__: platform.setup.basic

# Import the platform compose file.
# This generates target-scaffolding for terraform and ansible,
# and sets up syntactic sugar for target-dispatch under the "▰" namespace
$(call compose.import.as, \
    namespace=▰ file=demos/data/docker-compose.platform.yml)

# Implementing a fake setup for platform bootstrap:
#   1. Infrastructure is configured by the terraform container,
#   2. Application is configured by the ansible container,
#   3. Both tasks emit JSON events (simulating terraform state output, etc)

# Map targets to containers.  A public, top-level target.
platform.setup.basic: \
    ▰/terraform/self.infra.setup \
    ▰/ansible/self.app.setup

# Simulate the setup tasks for app and infrastructure.
# Note usage of `jb` to emit JSON, and `self.` prefix to hint
# these targets are "private" / not intended to run from the host.
self.infra.setup:
    @# pretending to do stuff with terraform..
    ${jb} log="infra setup done" metric=123 \
        event="terraform container task"

self.app.setup:
    @# pretending to do stuff with ansible..
    ${jb} log="app setup done" metric=456 \
        event="ansible container task"
Above we use namespace-style syntax for the container dispatch idiom to call tasks in containers, and we use jb to emit JSON, pretending we are running terraform output -json or similar.
Also note the usage of ${jb} instead of jb, which is expanded to use jb directly if available, or fall back to docker. (See the structured IO docs)
It's powerful, concise, expressive, and already orchestrating tasks across two containers defined in some external compose-file. The syntax is configurable, and it's even starting to look object-oriented.
Typically app-setup and infra-setup might further split into stages, but you get the idea. And the infrastructure/app split always comes up, but it might look different.. for example your setup might replace terraform with eksctl, and ansible with helm.
Extension with LME
Let's consider an extension of the platforming so far. Suppose output from platform.setup needs to be used by the next phase of bootstrap. For example, sending the platform output to different backends for logging, metrics, and events, respectively.
For this kind of thing it's most natural to think in terms of process algebra, and compose.mk makes it pretty elegant to express.
In the next example we'll use everything from the last exercise. For the sake of variety, we'll introduce a few other new idioms like logging and some workflow primitives
#!/usr/bin/env -S make -f
# Elaborating the `platform.mk` demo to include handlers for logging, metrics, & events.
# We use namespace-style dispatch here to run commands in docker, and use `compose.mk`
# workflows to describe data-flow.
#
# Part of the `compose.mk` repo. This file runs as part of the test-suite.
# See the main docs:  http://robot-wranglers.github.io/compose.mk/demos/platform/
# USAGE: ./demos/platform-lme.mk

# Import the contents of the last demo so we can elaborate on it here.
include demos/platform.mk
.DEFAULT_GOAL=platform.setup.observable

# 1. Logging uses the `elk` container,
logging: ▰/elk/self.logging
self.logging:
    $(call log.target, pretending to push log data somewhere)
    ${stream.stdin} | ${jq} .log

# 2. Metrics uses the `prometheus` container,
metrics: ▰/prometheus/self.metrics
self.metrics:
    $(call log.target, pretending to do stuff with the promtool CLI)
    ${stream.stdin} | ${jq} .metric

# 3. Events uses the `datadog` container.
events: ▰/datadog/self.events
self.events:
    $(call log.target, pretending to do stuff with the datadog CLI)
    ${stream.stdin} | ${jq} .event

# Bind all handlers into a single pipe
downstream_handlers: flux.pipe.fork/logging,metrics,events

# Send the `platform.setup.basic` output into a handler-target for each LME backend
platform.setup.observable: \
    flux.pipeline/platform.setup.basic,downstream_handlers
As in the previous example, this continues to use the ${jq} expansion for safe access to JSON parsing, and introduces the ${stream.stdin} macro as pretty way to write cat /dev/stdin
The example above introduces the flux.pipe.fork target for flow-control, which is used to send platform-setup's output into the three backend handlers.
This is just syntactic sugar for a 1-to-many pipe (aka a demultiplexer, or "dmux"). Each handler pulls out the piece of the input that it cares about, simulating further setup using that info.
Discussion
This is actually a lot of control and data-flow that's been expressed. Ignoring ordering, graphing it would look something like this:
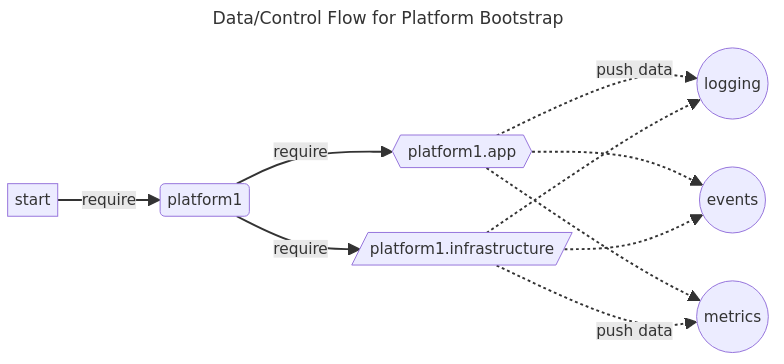
Not to belabor the point but we know what happens next is probably more platforms, more tools/containers, and more data flows. Let's watch how it blows up with just one more platform:
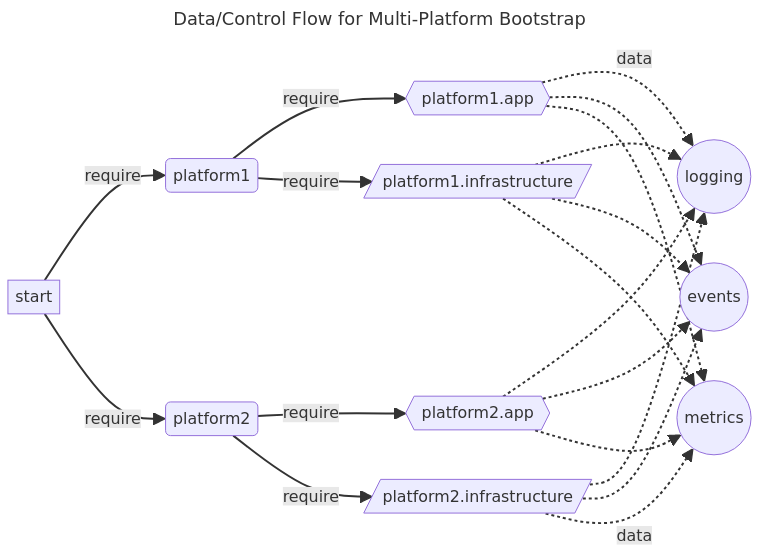
This tight expression of complex flow will already be familiar to lots of people: whether they are bash wizards, functional programming nerds, or Airflow/MLFlow/ArgoWF users. Still, this example pipes data between 5 containers, with no dependencies, and in remarkably direct way that feels pretty seamless!* It separates the automation itself from the context that it runs in, all with no platform lock-in. Plus.. compared to the alternatives, doesn't it feel more like working with a programming language and less like jamming bash into yaml? 🤔
If it doesn't yet feel like a "real" programming language compared with vanilla make, here's a quick look at an equivalent version ported to CMK-lang:
#!/usr/bin/env -S ./compose.mk mk.interpret!
# A version of demos/platform-lme.mk ported from Makefile to CMK-lang.
# See the other file for more details and docs, and the tutorial at
# http://robot-wranglers.github.io/compose.mk/demos/platform/
#
# Implementing a fake setup for platform bootstrap:
#   1. Infrastructure is configured by the terraform container,
#   2. Application is configured by the ansible container,
#   3. Both infra/app setup emits JSON events (simulating terraform state output, etc)
#   4. JSON from both is routed to all interested handlers
#
# Part of the `compose.mk` repo. This file runs as part of the test-suite.
# USAGE: ./demos/cmk/platform-lme.mk

.DEFAULT_GOAL=platform.setup.observable

compose.import(file=demos/data/docker-compose.platform.yml namespace=▰)

# Map targets to containers.  A public, top-level target.
platform.setup.basic: \
    ▰/terraform/self.infra.setup \
    ▰/ansible/self.app.setup

# Two "private" targets below, bound to specific containers by the target above.
# These emit JSON events using the arrow operator.
self.infra.setup:
    cmk.log.target(pretending to do stuff with terraform..)
    🡄 log="infra setup done" metric=123 \
        event="terraform container task"
self.app.setup:
    cmk.log.target(pretending to do stuff with ansible..)
    🡄 log="app setup done" metric=456 \
        event="ansible container task"

# Three paired public/private targets representing LME handlers.
# These consume just the parts of JSON they need to use.
# 1. Logging uses the `elk` container
# 2. Metrics uses the `prometheus` container
# 3. Events uses the `datadog` container.
logging: ▰/elk/self.logging
self.logging:
    cmk.log.target(pretending to push log data somewhere)
    🡆 .log

metrics: ▰/prometheus/self.metrics
self.metrics:
    cmk.log.target(pretending to do stuff with the promtool CLI)
    🡆 .metric

events: ▰/datadog/self.events
self.events:
    cmk.log.target(pretending to do stuff with the datadog CLI)
    🡆 .event

# Bind all handlers into a single pipe
# Send the `platform.setup.basic` output into a handler for each LME backend
downstream_handlers: flux.pipe.fork/logging,metrics,events
platform.setup.observable: \
    flux.pipeline/platform.setup.basic,downstream_handlers
Feels like it's zeroing in a minimum-viable description length for the sort of problem it's tackling. 👍
It's a neat party trick that compose.mk has features that look like Luigi or Airflow if you squint, but of course it's not really made for ETLs. In spirit, flux.* is more similar to things like declarative pipelines in Jenkins, and that's the way you'll probably want to use it.
Again, for a full blown project, see a preview of the WIP sister project at k8s-tools.git, which also breaks down automation into platforms, infrastructure, and app phases, but sets up and provisions a real cluster.